Heatmaps have become indispensable tools in retail, offering a treasure trove of business intelligence that empowers retailers to optimize floor space, enhance customer experiences, and ultimately boost sales. Thanks to continuous technological advancements, these visual data powerhouses are becoming smarter and more intelligent than ever before.
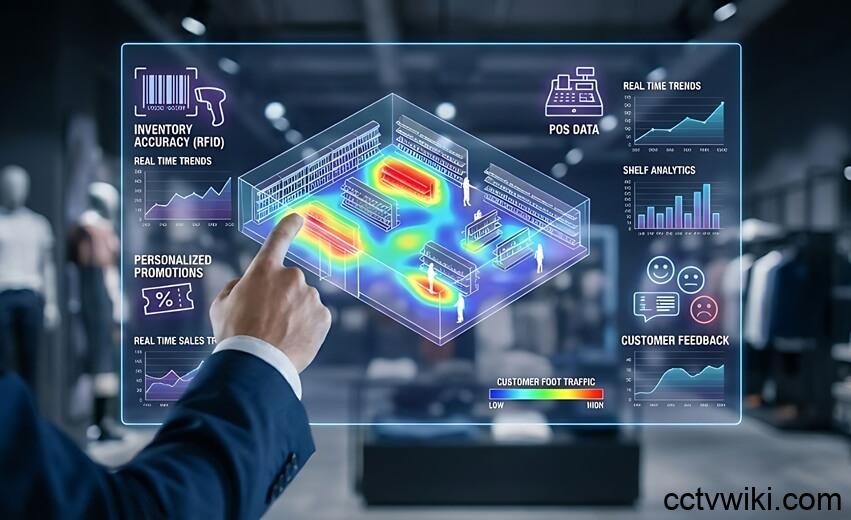
At their core, heatmaps aggregate data from various sensors, including security cameras and people counters. This raw data is then processed, either at the edge or in the cloud, to create a visual representation of activity. Conventionally, warm colors like red and orange signify high levels of activity, while cool colors such such as blue and green indicate lower engagement. This visual language helps retailers decode one of their biggest puzzles: understanding how customers navigate a store and interact with products.
“Heatmapping reveals where customer attention is concentrated within a store and how that attention changes over time,” explains Angel Cai, Marketing Manager at Milesight. “They highlight high-traffic areas, zones where customers slow down or dwell, and spaces that are consistently underutilized. These insights allow retailers to make practical adjustments, such as relocating key products to higher-engagement areas, redesigning low-performing zones, or adjusting staff presence where customer interaction is most likely. When reviewed over time, heatmapping also helps retailers evaluate whether layout changes or promotions are improving engagement or simply redistributing traffic.”
Let’s delve deeper into what retail heatmaps measure and why these metrics are crucial.
Foot Traffic: Mapping Movement for Maximum Impact
Foot traffic heatmaps vividly illustrate where customers move most frequently. Imagine a store where the entrance glows red with activity, but the back remains a cool blue. This insight immediately tells the store owner to strategically move popular items deeper into the store, enticing shoppers to explore more. Alternatively, they might improve signage or lighting in those less-visited areas. The benefits are manifold: improved sales per square foot, data-driven merchandising decisions, and a significant reduction in guesswork during store design.
Flow Patterns: Understanding the Customer Journey
Beyond simple foot traffic, advanced heatmaps now reveal customers’ intricate flow patterns – their entry points into specific zones and their subsequent destinations. This intelligence allows retailers to merchandise with unparalleled precision.
“Maybe you have created five or six zones, like kids’ zone, women’s zone and men’s zone,” illustrates Pritam Dey, Sales Manager for Middle East and APAC at V-Count. “The heatmap can give you data on what is the incoming traffic percentage from each zone – for example if a person is coming to the men’s zone, where they are coming from, and if a person is leaving the zone, where they are going. So if the store sees that most of the people who are coming to the men’s zone are from maybe the kids’ section, in the pathway they might put some products which might influence the kids to buy, maybe some toys or something.”
Dwell Time: Measuring Engagement and Interest
Dwell time refers to the total duration a customer spends within a defined zone. If a shopper pauses in front of a shelf for 45 seconds, that area accrues 45 seconds of dwell time. In the world of retail, this is a critical metric, and heatmaps offer invaluable insights.
“Dwell time is important for a very simple reason: You need to understand what is the amount of time that people are spending in certain sections,” Dey emphasizes. “So, if I’m an owner of a retail brand, and I have put some goods in a particular section, I need to figure out if people are getting interested in those products. I need to understand if in that particular section, where I have introduced my new product, people are spending a lot of time or not. If they are not spending much time, that means this is not something that has any interest to people visiting that zone. So I may have to adjust merchandising accordingly.”
Semantic Heatmapping and Other Groundbreaking Developments
While heatmaps are not a novel concept in retail, their evolution is relentless. Contemporary developments are making them more intelligent and intuitive than ever before.
One prime example is semantic heatmapping. By integrating with AI cameras and other sophisticated solutions, semantic heatmaps enrich raw data with context and labels. Retailers can now discern not only *where* activity occurs but also *who* (customer or staff) is performing the activity and *what* they are doing (simply browsing, picking up a product, or even purchasing).
“Heatmapping is evolving from simple density visualization into a more context-aware analytical tool,” Cai confirms. “One key development is semantic heatmapping, where AI adds behavioral context to the data. This allows retailers to distinguish how space is used – for example, pass-through traffic versus dwell or queue behavior.”
Cai also highlights other significant advancements: “Another advancement is improved analytical precision. Modern heatmapping is less affected by environmental factors like lighting changes or background motion, resulting in more stable and reliable insights in real-world retail environments. Heatmapping is also becoming more operationally connected, allowing data to be reviewed over time, compared across locations, or correlated with layout changes and business performance. Together, these developments make heatmapping more actionable, shifting it from visualization to decision-support intelligence.”
Ultimately, the innovation in heatmaps transcends merely assigning red to hotspots and blue to cold spots.
“The evolution of heat mapping goes beyond ‘coloring areas’ with colors,” states Tamer Mohannad, Regional Sales Manager for Middle East and Africa at SCATI. “The trend is to make it more useful and actionable: analysis by periods and comparisons (by campaigns, days, time slots), greater precision in permanence and routes, and contextual enrichment when correlated with operational or security events. At the same time, AI-based analytics allows us to move from density maps to behavioral interpretations, so that heat mapping is not just visualization, but real support for deciding what to change in the store and how to prioritize actions. In short, it is not the graph that is ‘smart,’ but the ability to convert it into operational decisions.”