
 Check Port Open
 Disk Calculator
 Camera Calculator
 DMSS QR Generator and Decoder
 Super Password
 CCTV Quiz
 Facebook Profile Search

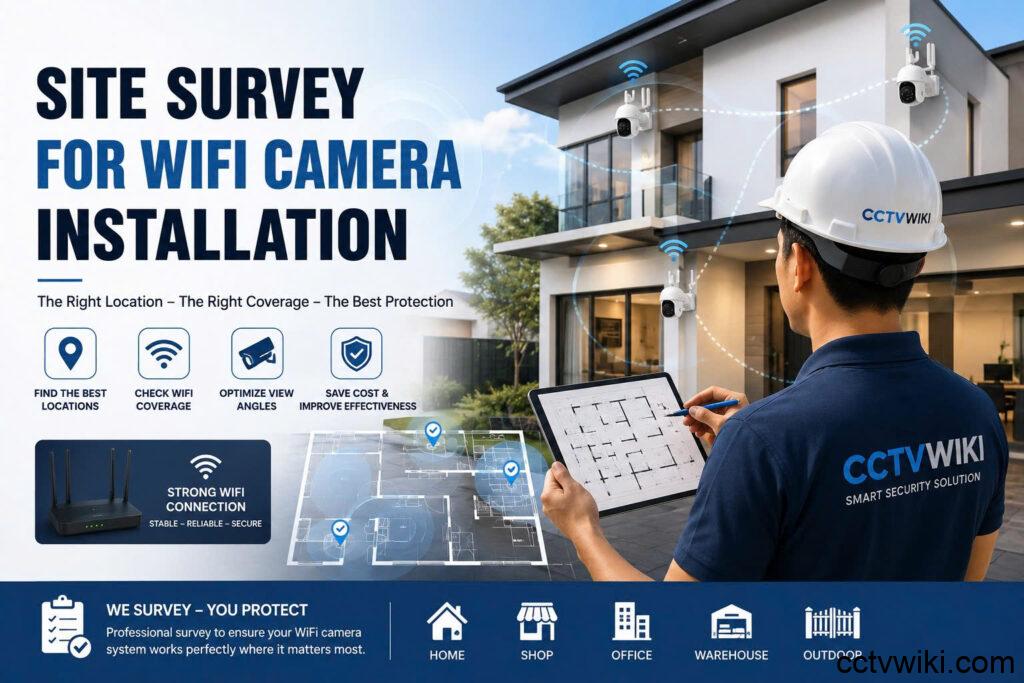
Quoting a Wi-Fi camera job without measuring is guessing. You find out the back corner sits at −78 dBm after the camera is on the wall, the picture breaks up, and the callback costs more than the job paid. This is what a CCTV WiFi site survey does on an ordinary phone: what it measures, how it grades each position, and what you hand the client before you name a price.
Why a full signal icon tells you nothing
The Wi-Fi icon on a phone has three or four bars. A camera needs a number. Between −55 dBm and −70 dBm that icon can look identical, while the link rate has fallen from 433 Mbps to a few dozen — and a 1080P camera recording 24/7 needs several times its own bitrate in headroom before motion stops breaking the picture.
Three more things matter that no icon shows:
- Latency and jitter to the router — this is what decides whether live view is smooth.
- Packet loss — 1–2 % is enough to blockify an H.264 or H.265 stream.
- Channel congestion — a neighbour on the same 2.4 GHz channel congests a strong signal just as effectively as a weak one.
What the survey measures
At each position — one 30-second reading
Stand where the camera will go, hold the phone still, start the reading. Over 30 seconds the app samples continuously and records:
- RSSI with the sample count behind it — the count matters, because a single reading says nothing
- Link rate, band, channel and Wi-Fi standard (802.11n / ac / ax)
- Co-channel neighbours and channel utilisation
- Latency, jitter and packet loss to the router, with the packets sent and answered
- Which handset took the reading
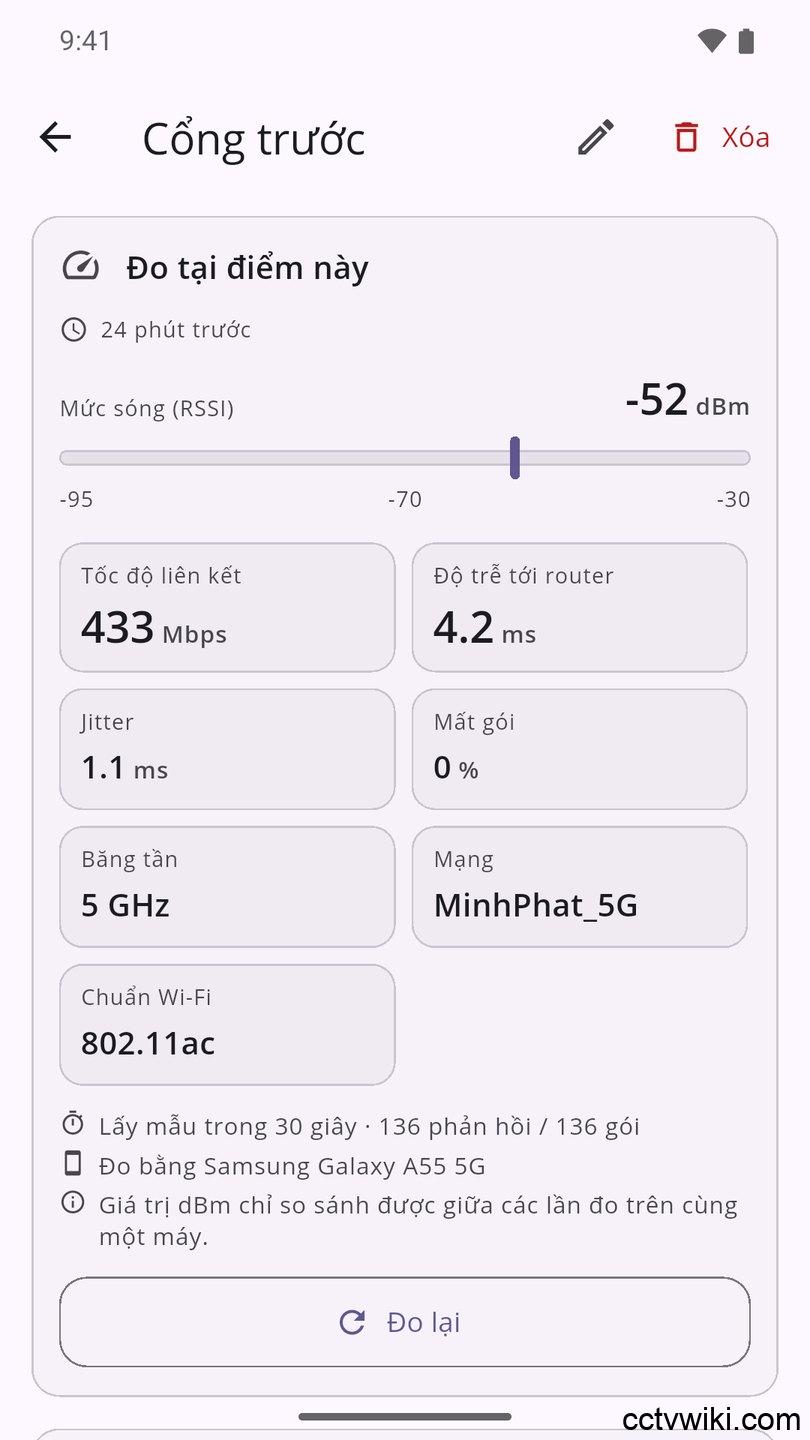
That last line is not filler. Two phones standing in the same doorway can report figures 20 dB apart, because their antennas differ. A dBm value only compares against other readings taken on the same handset, and the report prints the handset beside the number so whoever reads it knows.
Once for the whole site — the internet line
A site has one internet connection, so this runs once and is shared: download, upload, latency, jitter, packet loss and ISP.
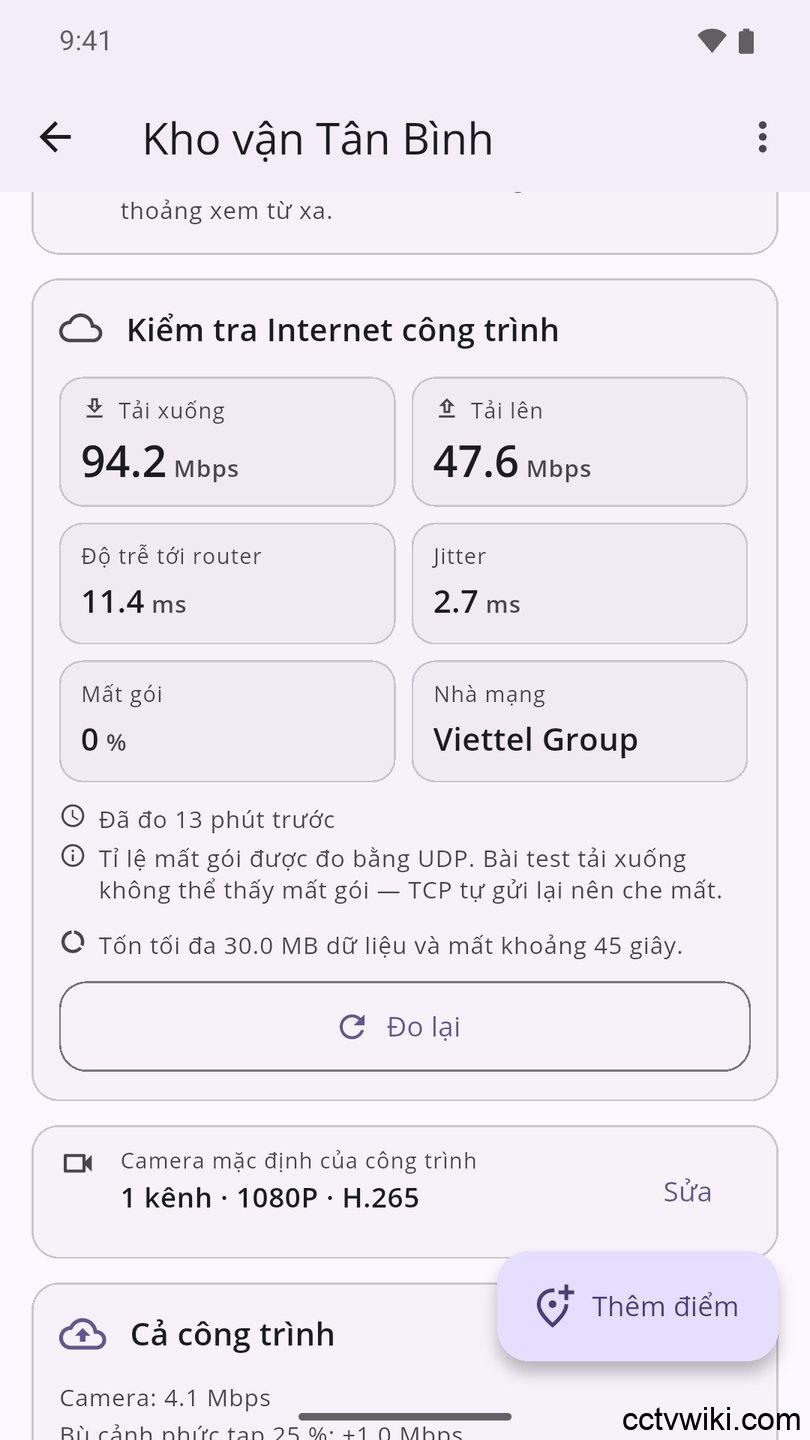
Note the word upload. Clients quote you their download speed, because that is the number on the bill. Watching cameras remotely sends data out of the building, so it spends upload — which on most consumer fibre packages is a fraction of the download figure.
Grading and verdicts
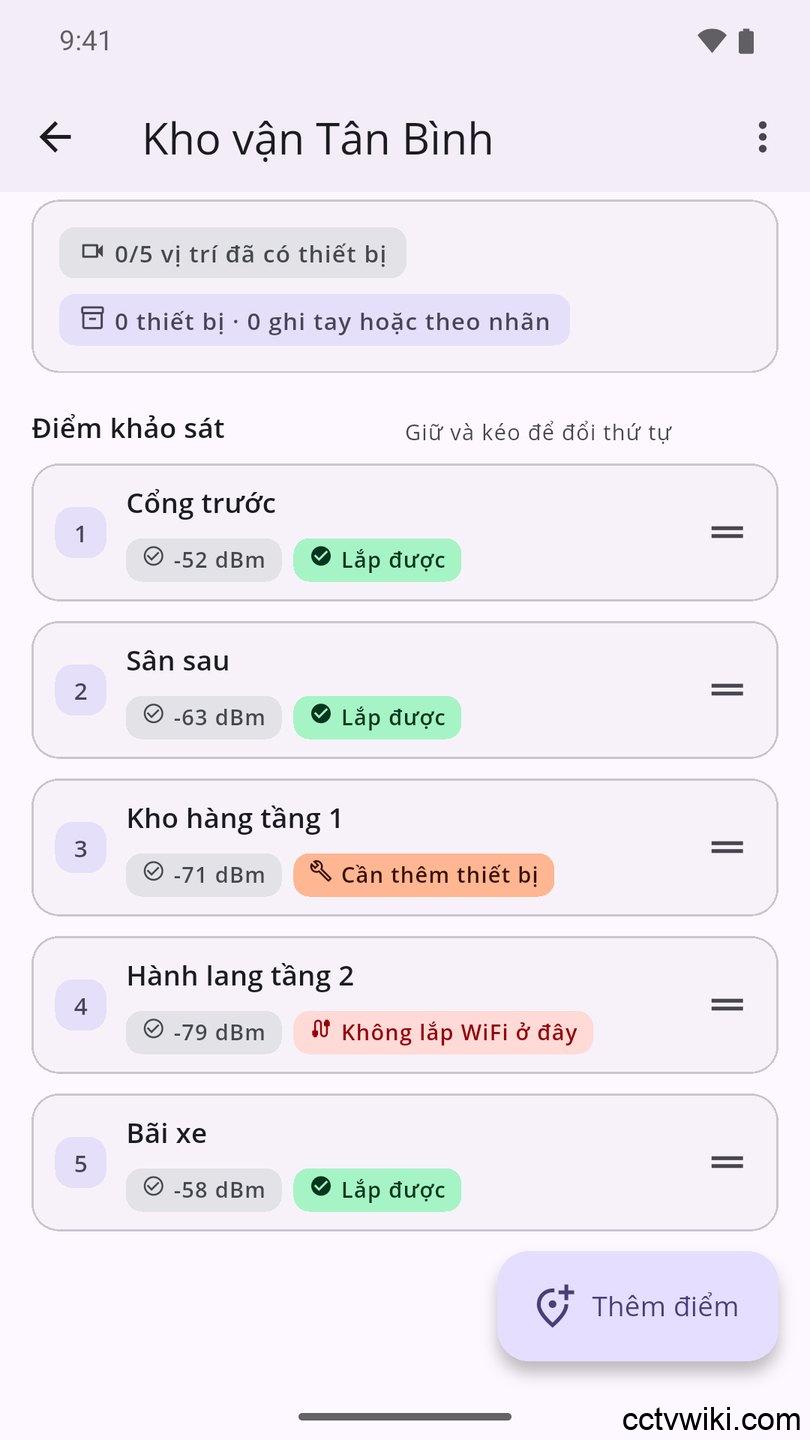
The app scores out of 100 across five weighted axes: signal strength, link rate against the camera’s bitrate, packet loss, jitter and channel congestion. Four hard caps sit on top — a signal that is simply too weak ceilings the score no matter how good the other axes look.
Four grades
| Grade | What it means |
|---|---|
| Good to install | Comfortable headroom; 24/7 recording and remote viewing are stable |
| Workable, but only just | It will run, but state the condition to the client in writing |
| Needs more equipment | An access point, a mesh node or a cable run is required first |
| Do not put Wi-Fi here | Pull cable, or move to a position that already graded better |
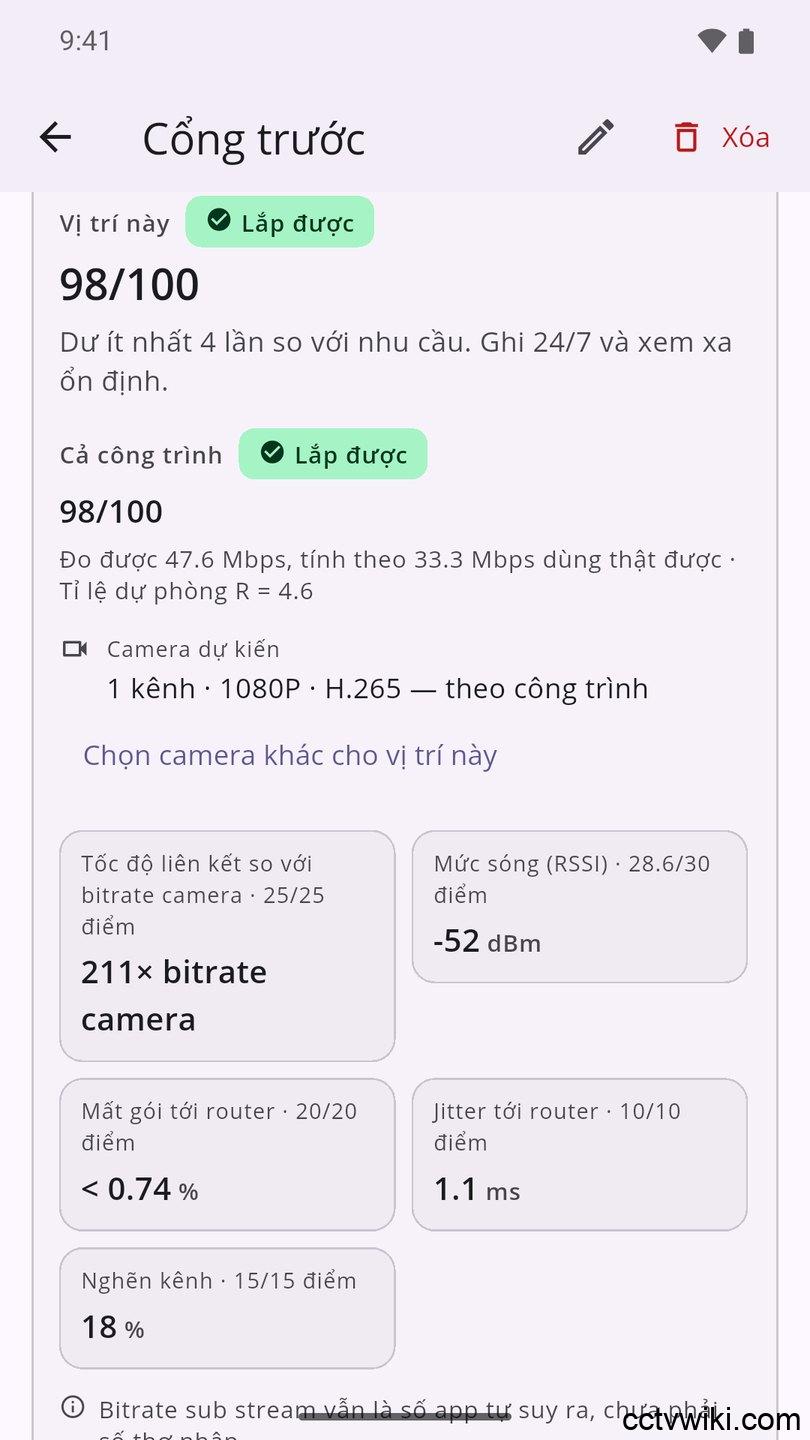
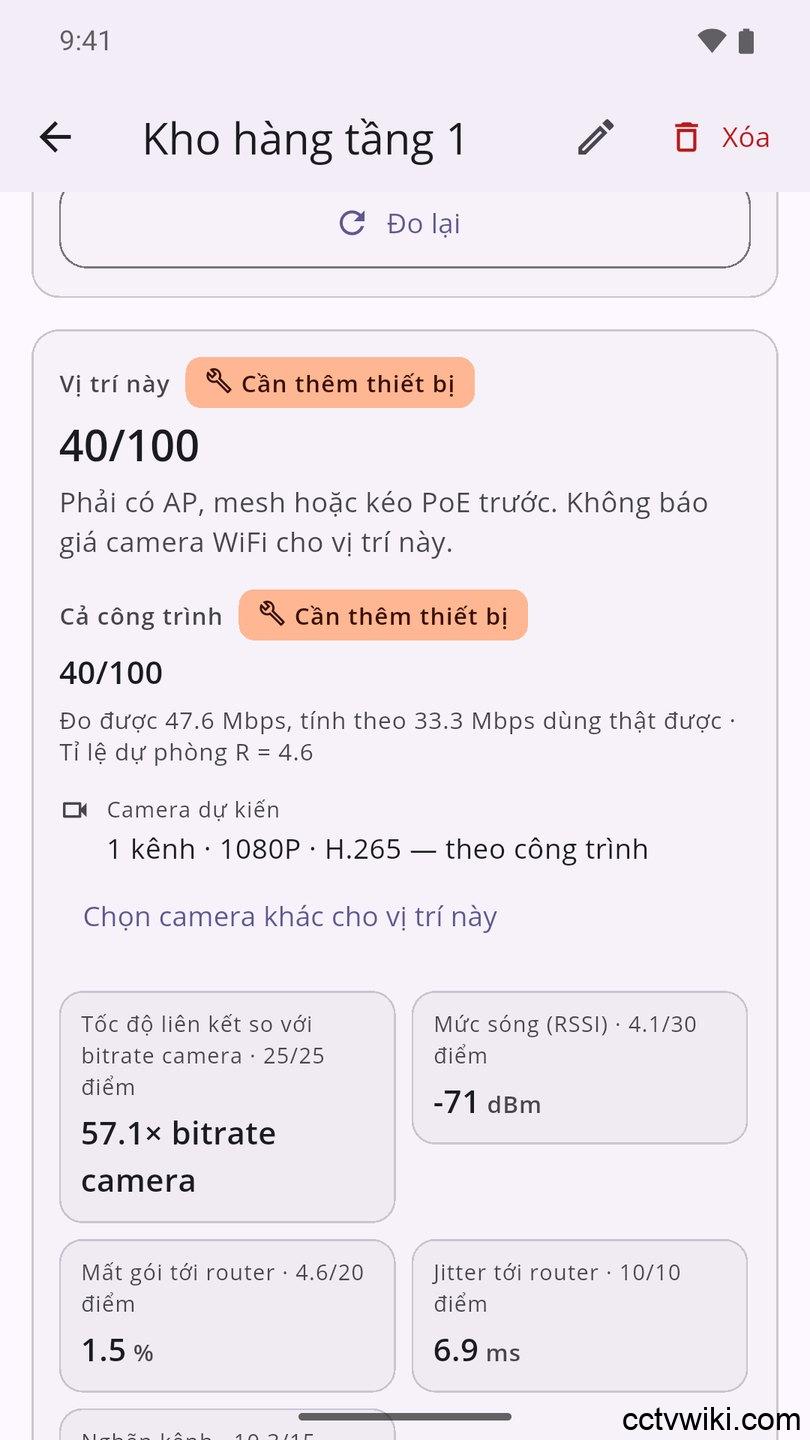
Every verdict carries what to do about it, the threshold it used, and where that threshold came from — so when a client asks why you will not put a camera on that wall, the answer is a number rather than an opinion.
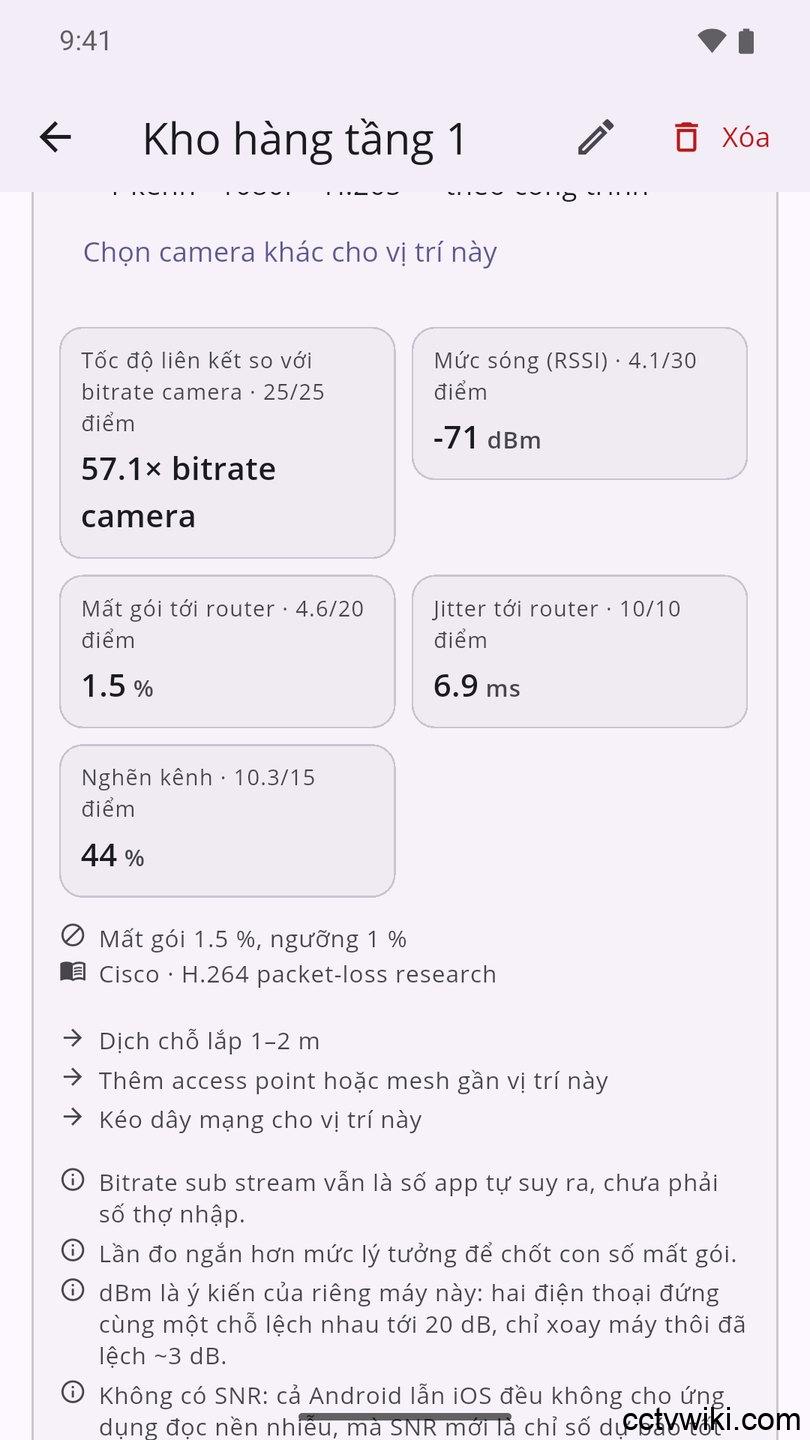
Not enough evidence means “not judged”, not zero
This is the part worth understanding. When an axis cannot be settled — say too few packets went out to be confident about loss — the app does not score that axis zero. It shows a dash with the reason, and the result becomes a range such as 40–98: at best 98, at worst 40, measure longer to close the gap.
An axis that could not be measured earns nothing and forgives nothing. That avoids the confidently wrong report — better to say “not yet known” than to state a grade that only falls apart once the camera is up.
How much upload the site needs
The app adds up the bitrate of every planned camera, adds headroom for busy scenes, adds an allowance for remote viewing, and compares the total against the line it measured.
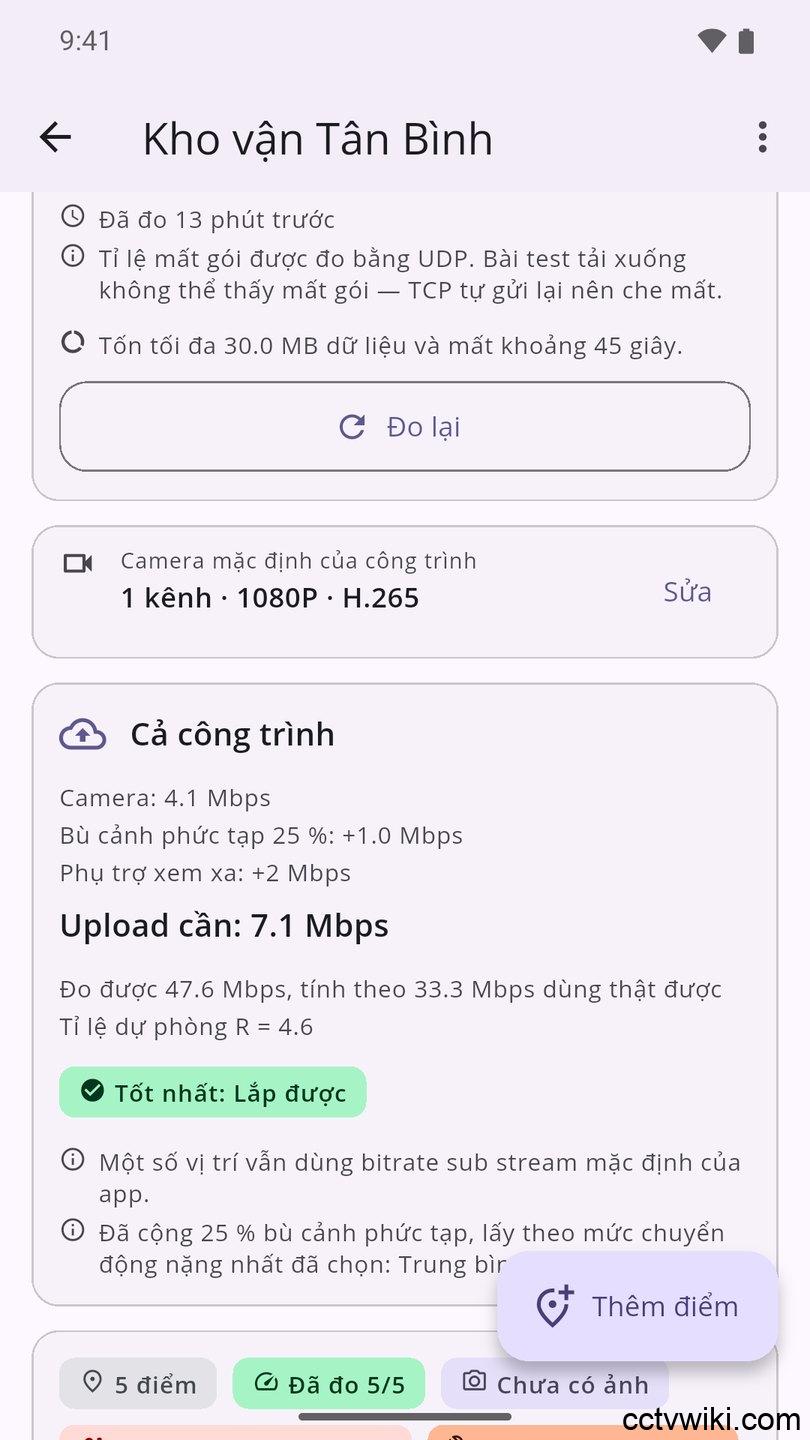
The output is a reserve ratio. At 4.6× there is room to spare. At 1.0× the cameras stall the evening somebody streams a film. The same figure works backwards onto each position too: if the line cannot carry the site, a position with a beautiful local signal still gets downgraded.
The PDF the client keeps
Two documents come out: a survey report and an acceptance record.
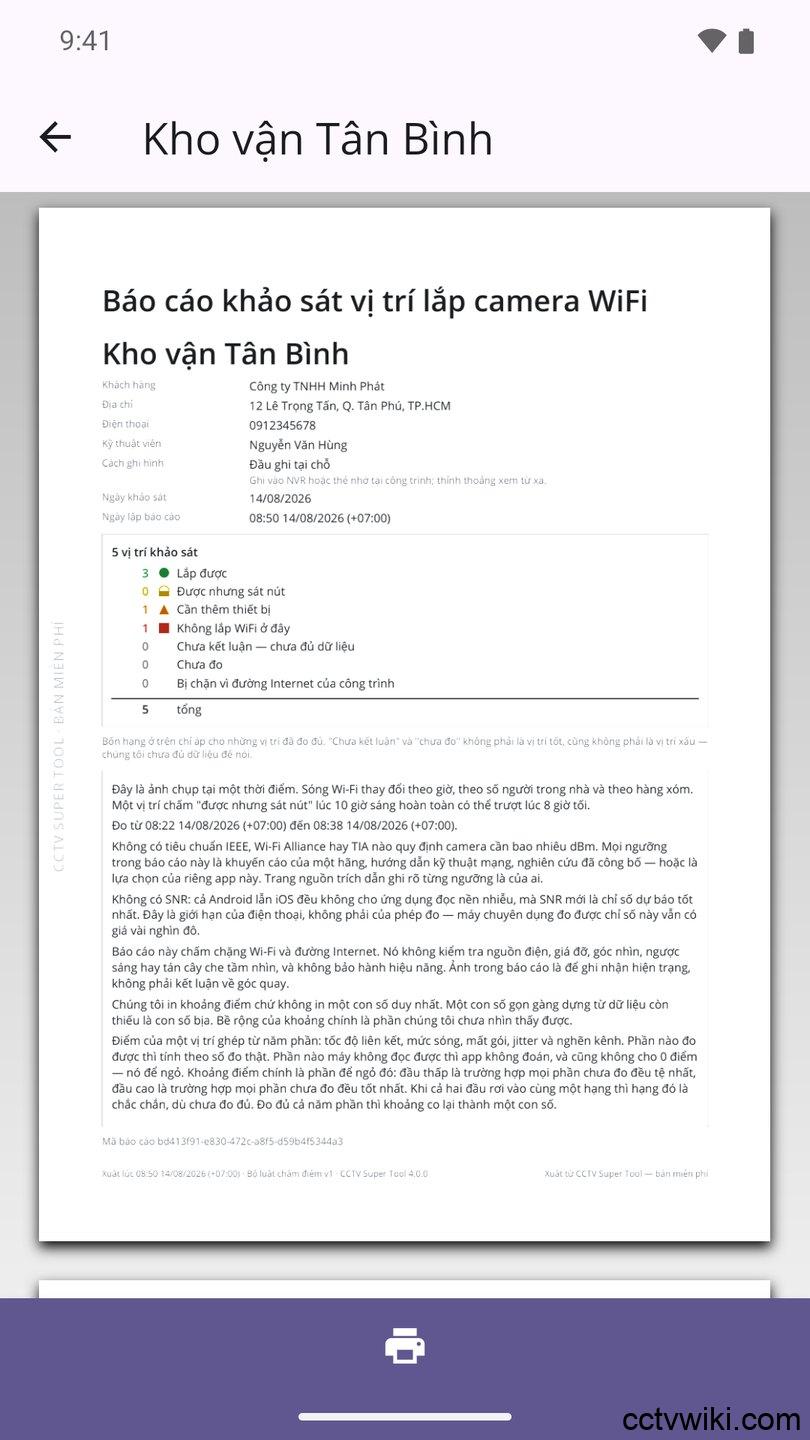
The survey report opens with the client’s details, a reconciliation tally of positions, the internet-line page, a summary table, a section per position, a conclusion, a page of thresholds with their sources, and a page setting out how the measurements were taken and what they cannot tell you.
Every copy carries a report id, a content fingerprint and a timestamp with its timezone — so if there is ever a disagreement, both sides can tell whether they are holding the same document. The report language is chosen independently of the app language, and photos can be included or left out.
The survey in six steps
The survey in six steps
- Create the job: client name, address, phone.
- Choose how footage is recorded — local NVR or remote viewing. The two size bandwidth differently.
- Measure the site’s internet line, once.
- Add a point for each planned camera position, with photos and notes.
- Stand at each position and take the 30-second reading.
- Export the PDF, send it, and only then quote.
Frequently asked questions
Ten to fifteen minutes. The internet test takes 45 seconds, each position 30 seconds, and the rest is walking and photographs.
Only the speed test does. The per-position measurements run entirely on the local network.
No. iOS exposes no signal strength, channel or link rate to any app, and does not allow scanning for nearby networks — this is an operating-system limit, not an app one. On iPhone and iPad the app still measures latency, jitter and packet loss to the router, and still produces the report, but the grading leaves the signal axes blank and reports a score range instead of settling on a verdict. Full grading needs an Android handset.
No. Surveys, photos and client details stay on the phone. There is no account and no server holding a copy, and survey data is excluded from cloud backup — so exporting the PDF is the only way to keep one. Export before you change phones.
The job shown is demonstration data. The scores, grades and recommendations, however, were computed by the app’s own grading engine from those readings rather than written by hand.
Get the app
CCTV Super Tool is on Google Play and the App Store. Alongside the survey it scans the local network for cameras over ONVIF, Dahua/KBVISION and Hikvision, checks port forwarding, sizes recorder storage and looks up warranty by serial number.
